
TRON was developed as a blockchain-based operating system to enable developers to create decentralized applications and share media content without lo
TRON was developed as a blockchain-based operating system to enable developers to create decentralized applications and share media content without losing control of their ownership rights. It can also be used to gain access to multiple different features on the TRON network.
Furthermore, just like Bitcoin, the cryptocurrency of the TRON blockchain, TRX is also considered a valuable cryptocurrency for storage value. Created in 2017, it acquired BitTorrent in 2018 after developing its blockchain instead of relying upon Ethereum.
TRX reached its peak of $0.30, which currently trades below $0.06, showcasing a huge decline from its all-time high. Viewers can use the TRON network to ensure their contribution directly reaches the content developers using TRX tokens instead of relying on them to reward the developers. The market position of TRX has recently reached the 14th position with a market value exceeding $5 billion.
TRON price action showcases a declining pattern on the longer duration charts. The decline concerns not only the price action but also the transaction volumes showcasing tough challenges in overcoming the resistance levels.
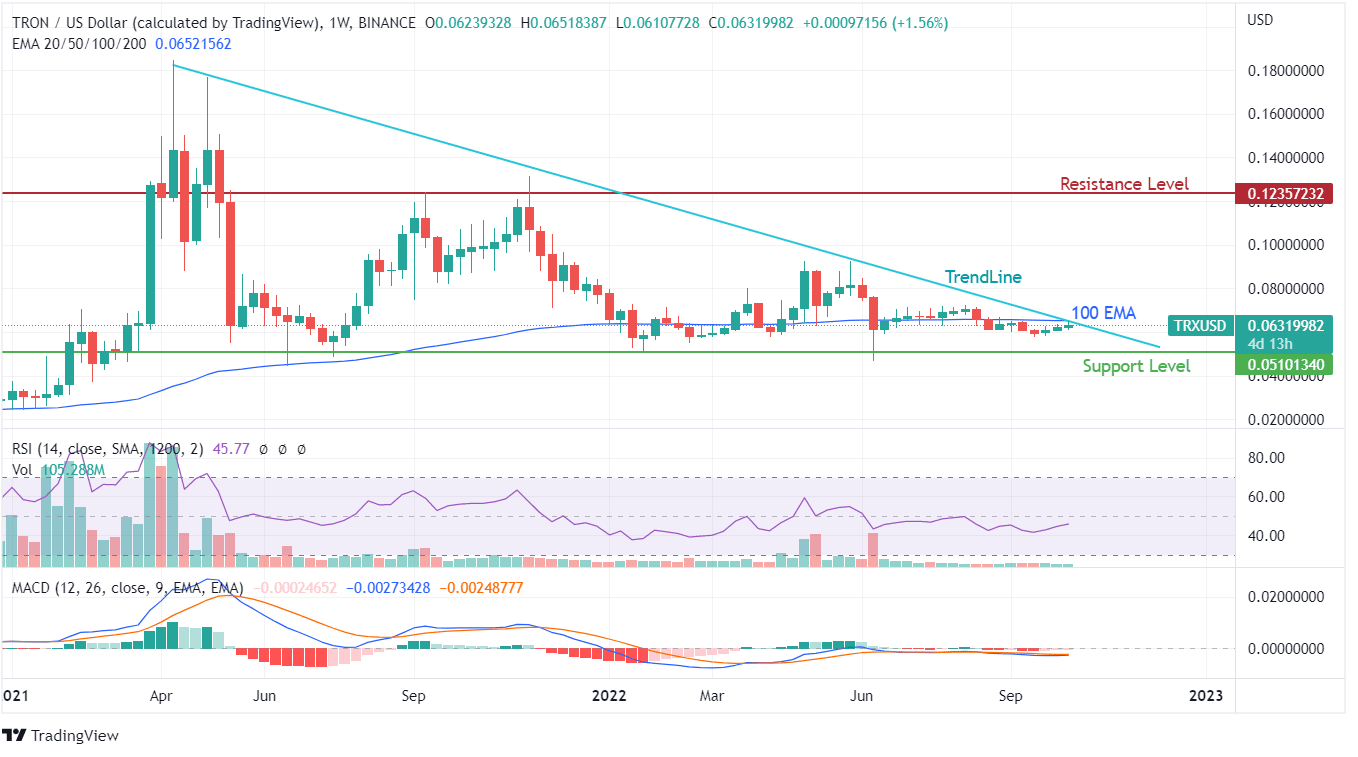
TRX price action showcases a declining upper band with a consistent lower band; there have been more than five attempts to breach the negative trendline, but none have managed to taste success so far. The resistance level of $0.12 and support from $0.05 has been helping traders make positions in a wider zone.
The price action of TRON is currently battling the resistance developed around the 100 EMA curve as holders could attempt to book profits. During this phase, RSI has barely reached above the 45 levels, with MACD still unable to showcase the price momentum possibilities.
On a daily candlestick pattern, the TRX token has moved decently in the last three weeks and prompted the RSI indicator to move above 55. The MACD indicator for TRON cryptocurrency is gradually entering the positive domains on daily charts. Holding such bullish charts for two-three months could reflect a positive price probability even on weekly charts, which have refrained from showcasing a positive movement.
COMMENTS